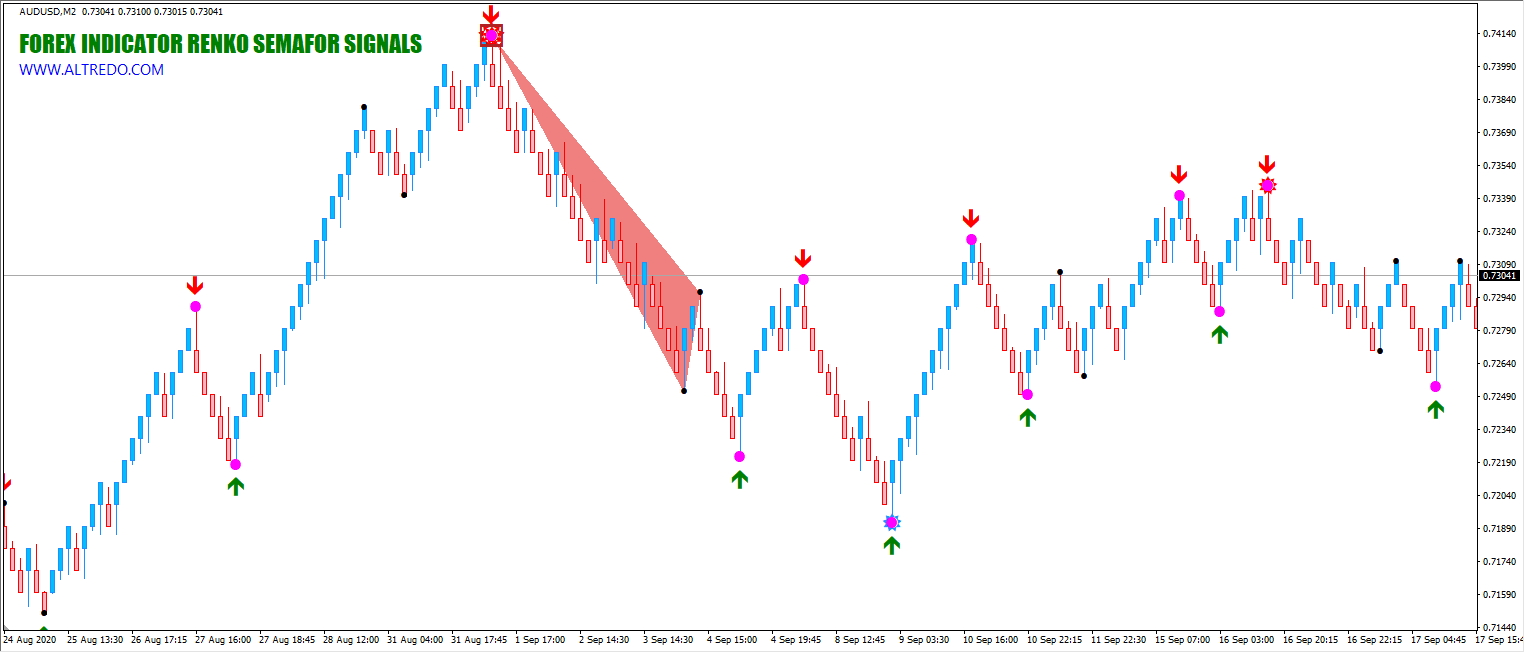
Renko charts help determine the trend, indicate important support or resistance levels.
You can work with them in the same way as with regular bar or candlestick charts.
Renko chart is an excellent filtering of small price movements,
it presents the usual candlestick chart as a sequence of up and down trends, practically without a flat.
This fact greatly simplifies the perception of the graph.
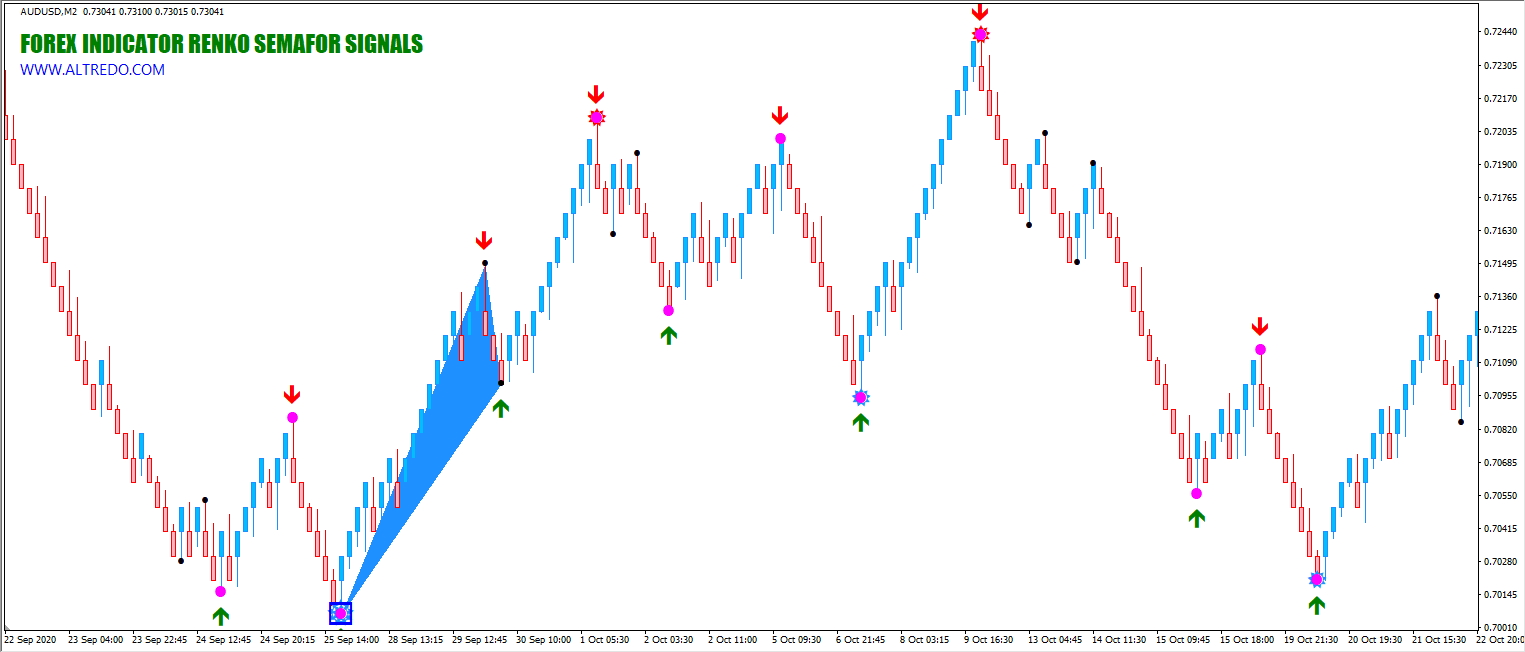
Renko chart also gives us trend reversal signals. Changing the color of the bricks is a reason to believe that the trend has changed.
In addition, the Renko chart allows you to quickly and easily find strong support and resistance levels.
They are simply plotted along the tops and bottoms of the Renko chart.
Renko bricks are formed at the closing prices, which means that only after the candle closes, we know how many bricks will form and in which direction,
bullish or bearish. This is one of the reasons why it is customary to build Renko charts based on minute charts.
✅ Accurate identification of the incipient trend,
✅ Reduced noise level,
✅ Compatibility with standard indicators,
✅ The possibility of using automatic advisors.
 Download FREE Now!
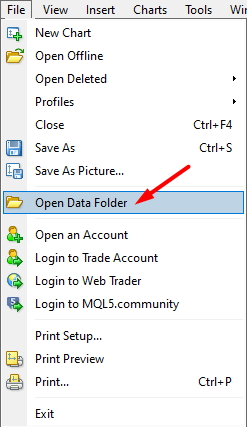
Next, open the MT4 terminal, click "File" at the top of the toolbar and select "Open data directory" inside.
In the window that opens, simply drag everything that was in the folder "1" of the downloaded archive, agreeing
to replace the files in the "Sounds" folder. Then we drag everything that was in the "2" folder here,
again agreeing to replace the files, but now for the "MQL4" folder.
As soon as these actions are completed, you need to restart the mt4 terminal, find the
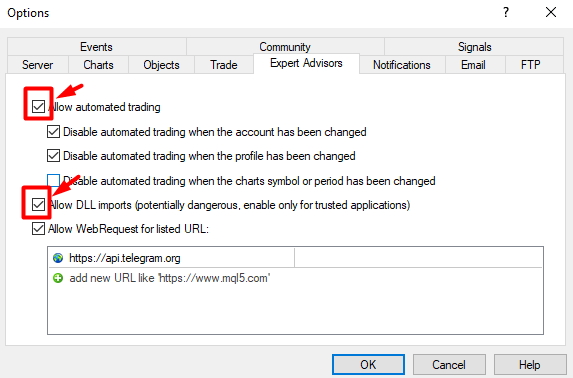
"Service" item at the top of the toolbar, enter it by clicking "Settings"
and go to the "Expert Advisors" tab. There should be a checkmark, as in the screenshot below.
At the next stage, you need to open a regular candlestick chart of the desired pair, choosing the M1 timeframe. Next,
drag the RenkoChart_0 indicator onto this chart, which can be found on the left in the "Navigator" window.
It can also be found through the "Insert" menu item, selecting there the "Indicators" and "Custom" sub-items.
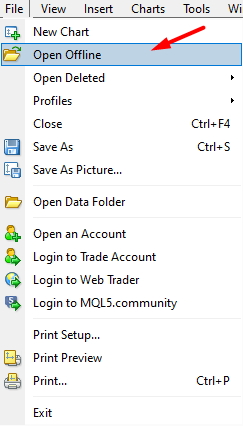
Having connected the Renko charts indicator for mt4, you need to go to the "File" menu again, click on "Open offline" there.
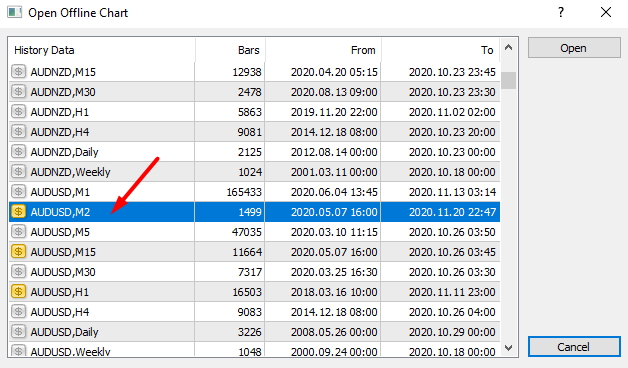
After that, you need to find the chart of the required currency pair, which will be marked M2 (or M3), and double-click on it with the left mouse button.
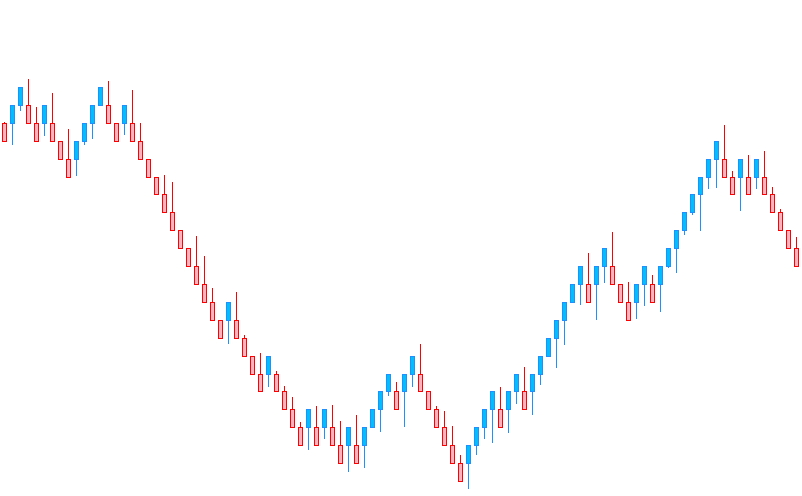
If everything was downloaded and installed correctly, then the Renko chart will open in mt4. It will look like this by default.
Attach the semaphore signal indicators and the BUY / SELL arrow signal indicator to the resulting Renko chart:
RenkoSignals_1, RenkoSignals_2, RenkoSignals_3.