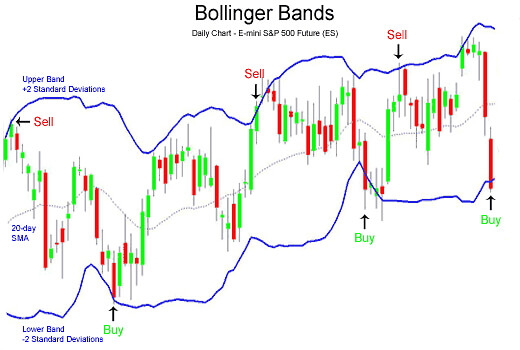
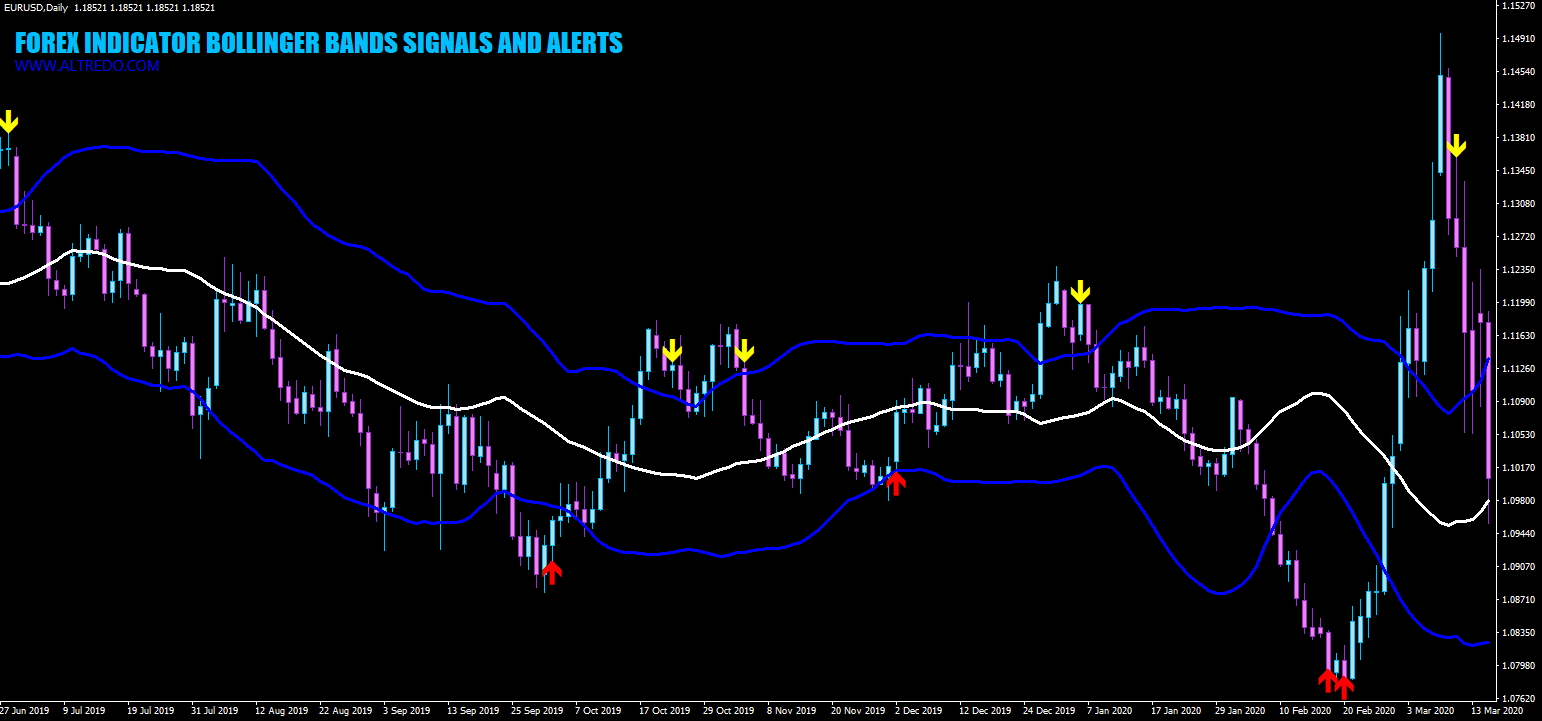
Bollinger Bands is a trend indicator that displays the state of the market at a particular moment. The Bollinger Bands indicator is a classic trend indicator used to determine the location of the price in relation to its standard trading range. Unlike other instruments based on similar principles, it can measure not only the direction of price movement, but also its speed.

On the indicator chart, we see a channel with a normal trading range between its borders. Most of the time (≈95%) the price moves within these limits. A channel is built on the basis of a simple moving average, above and below from which two other Moving Averages are equidistant. The distance from the center band is proportional to the Standard Deviation. Depending on whether this indicator decreases or increases, the channel boundaries narrow or widen. Accordingly, volatility decreases or increases.
✅ If the price starts to move from one of the boundaries, it will most likely reach the opposite one.
✅ The narrowing of the band is usually accompanied by sharp price fluctuations. The probability of a breakout increases.
✅ If the price has broken the border line and moves further, we can talk about the continuation of the trend.
✅ Outside the bands may not last longer than four bars. It is recommended to open against the trend right after the formation of the fourth candle.
However, practice shows that exceptions are not so rare here.
✅ If the high / low formed outside the bands is replaced by a similar extreme inside the channel, there is a high probability that the trend will change soon.
 Download FREE Now!