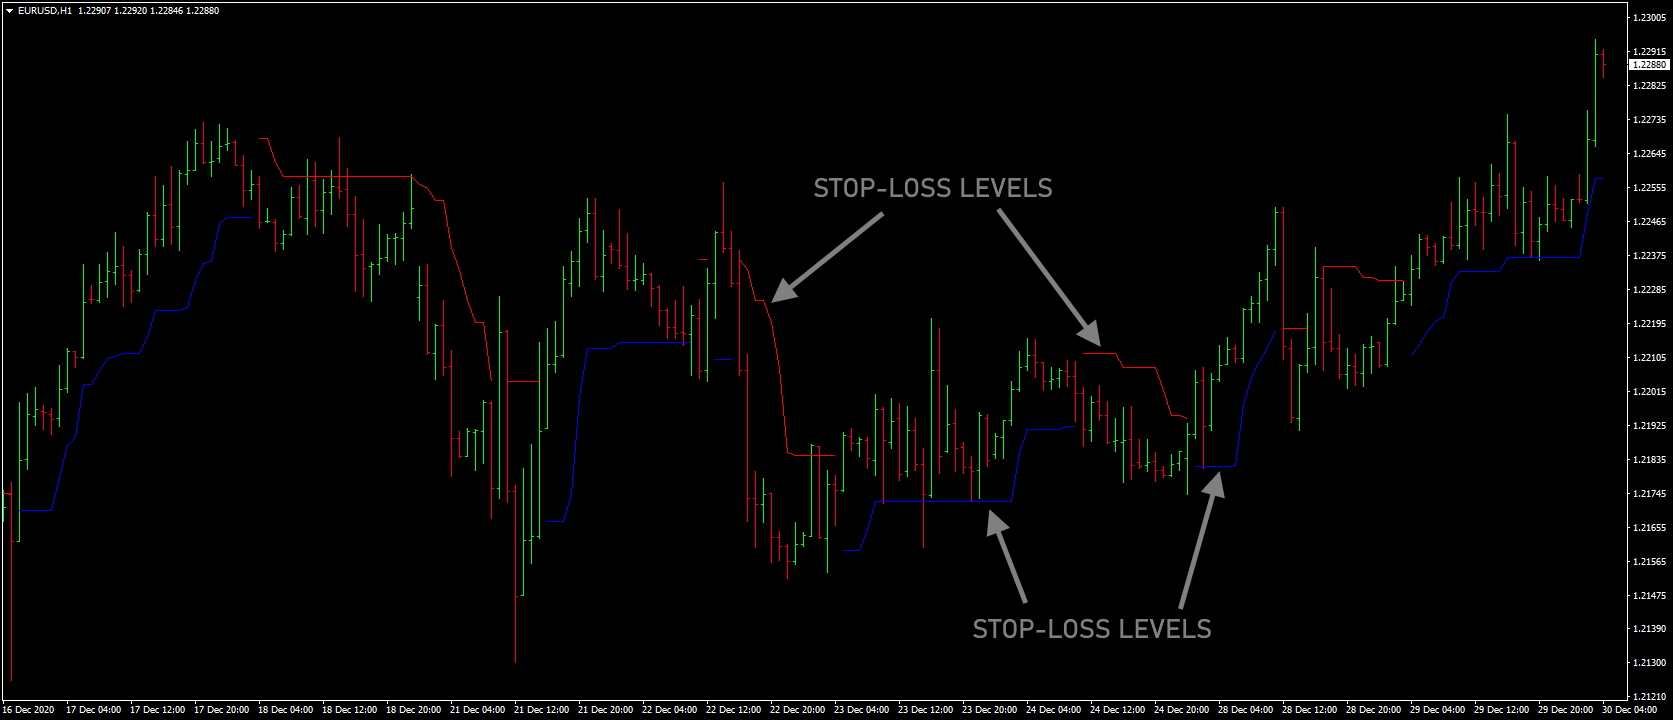
▶️ Indicator АТR - (Average True Range) - this is the average true price range.
This indicator is used for the average determination of volatility over a certain period of time.
With the help of ATR, traders place stop orders, or estimate the potential in a particular deal.
▶️ Indicator ATR is usually used in combination with other indicators as a filter.
For example, when trading trending strategies, ATR helps filter out unnecessary noise on the chart and signals a
price transition to flat.
▶️ ATR can be used to find the point to set a protective Stop-Loss in accordance with the current market situation.
This allows the trader to avoid setting too small protective stops in high volatility conditions.
That is, the higher the ATR value (the stronger the volatility), the wider the stop-loss should be.
Conversely, with low volatility, the stop-loss should also be small.
▶️ ATR is often used to find the close points of a trade opened in the direction of the trend. For example,
if the Average True Range value is still high enough, then the trend potential has not yet been exhausted and you can postpone
closing the position. If the ATR falls, on the contrary, it is better to close the current deals, since the market volatility falls
and the chart may turn into flat.
▶️ First, the value of the ATR line at the moment is determined.
▶️ A multiplier is selected. It can be anything, but you can start by using one.
▶️ The ATR value is multiplied by a factor. For example, ATR is 18, and the multiplier is 1.
So 18 needs to be multiplied by 1. The resulting value will be the distance to set the stop-loss.

ATR indicator Stop-Loss Levels free download:
Download FREE Now!